

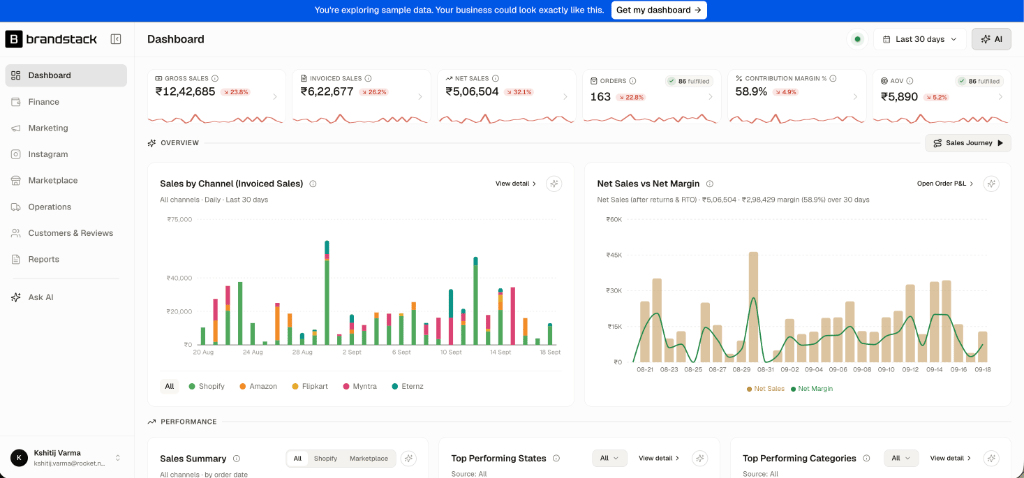
Brandstack Morning Command Center: Top KPI strip and daily channel performance
The 8:00 AM Rule: Most founders lose 1 to 2 hours every morning cross-referencing mismatched spreadsheets. The Brandstack dashboard is built so you can assess top-line revenue, true bank margin, cash collection risk, and operational fires in under 3 minutes.
1. Top KPI Strip: The True Health of Your Brand
At the top of your dashboard sits the 6-metric executive health strip. In e-commerce, headline revenue is vanity, invoiced sales is reality, and net margin is survival. Brandstack displays this 3-tier truth side by side:Gross Sales
Total value of all orders placed, before any customer discounts, cancellations, or returns.Why it matters: Tells you total market demand and top-of-funnel checkout volume.
Invoiced Sales
Actual billed revenue generated from orders that were successfully confirmed and packed.Formula:
Gross Sales − Discounts − Pre-Dispatch CancellationsNet Sales
Cash kept by your business after accounting for customer returns and RTOs (Return to Origin).Formula:
Invoiced Sales − Customer Returns − RTO OrdersTotal Orders & Fulfilled
Shows total orders placed alongside the count of orders already fulfilled and dispatched by your warehouse.Why it matters: Instantly flags dispatch backlogs before shipping SLAs breach.
% Contribution Margin
The percentage of revenue that lands in your bank after covering COGS, shipping, packaging, and payment fees.Why it matters: If this drops below your target (e.g., 50%), scaling ad spend will burn cash.
AOV (Average Order Value)
Average net transaction size across all channels.Why it matters: Higher AOV gives your marketing team breathing room against rising ad CPMs.
Every KPI card includes a real-time sparkline and a percentage change indicator comparing the current period (e.g.,
Last 30 days) to the previous period. A red indicator (↘) flags areas requiring attention, while green (↗) signals positive growth.2. Overview: Daily Velocity & Profit Alignment
Directly below the KPI strip, the Overview section contrasts top-line channel volume against actual net margin.A. Sales by Channel (Invoiced Sales)
This interactive, stacked bar chart maps your daily invoiced revenue across every storefront and marketplace:- Shopify (D2C Store) — Direct web sales
- Amazon — Seller Central orders
- Flipkart — Seller Hub orders
- Myntra — PPMP orders
- Eternz — Partner marketplace sales
B. Net Sales vs Net Margin
This dual-axis visualizer plots Net Sales (tan vertical bars) against Net Margin (green line overlay):- The Insight: High sales days do not always equal high profit days. If Net Sales shoots up by 2× on a promotion day but the Net Margin curve stays flat or dips, you are giving away margin through excessive discounting, expensive expedited shipping, or low-margin product mixes.
- Drilldown: Click Open Order P&L > in the top-right corner of the card to inspect line-item profitability down to the individual order level.
3. Performance & Margin Reconciliation
The middle section of the dashboard exposes where revenue leaks occur, which geographies buy the most, and which product categories drive your catalog.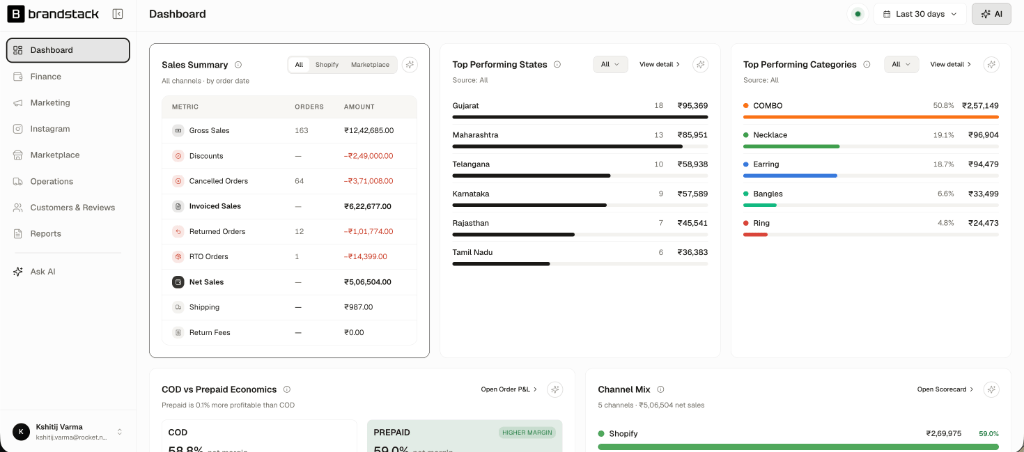
Sales Summary waterfall reconciliation, top performing states, and category share
A. The Sales Summary Waterfall
In multi-channel e-commerce, money leaks at multiple stages between customer intent and bank settlement. The Sales Summary Table provides a transparent reconciliation:B. Top Performing States & Categories
- Top States: Ranks order volume and revenue by state (e.g., Gujarat with 18 orders / ₹95.3K, Maharashtra with 13 orders / ₹85.9K). Cross-reference this with courier delivery SLAs to see where to place regional warehouse inventory.
- Top Categories: Shows percentage contribution by catalog category (e.g., COMBO accounting for 50.8% of sales at ₹2.57L, followed by Necklaces at 19.1% and Earrings at 18.7%). When bundles/combos dominate, your AOV remains high and amortizes fixed shipping costs.
4. Unit Economics: COD vs. Prepaid & Channel Mix
Cash flow and unit economics vary wildly depending on how customers pay and where they purchase. Brandstack isolates these economics into dedicated scorecards: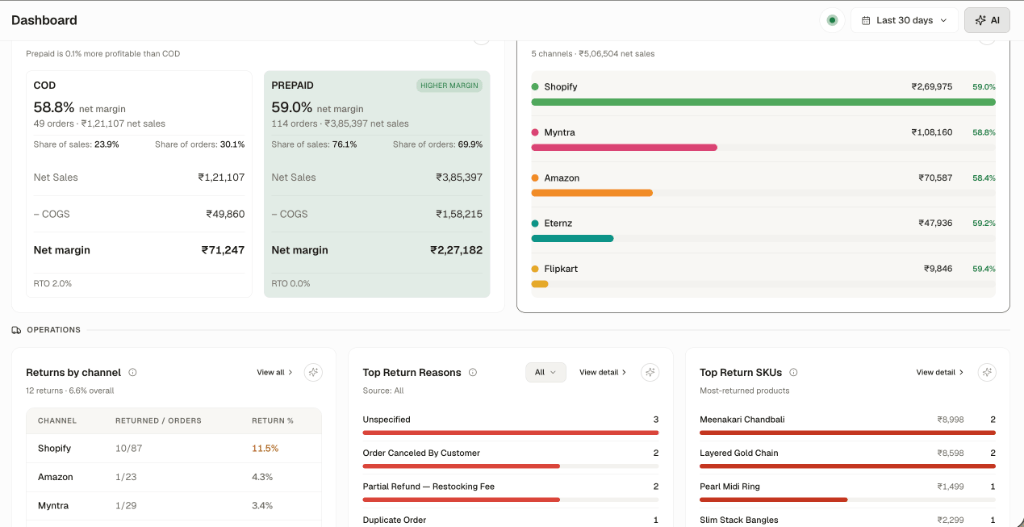
COD vs. Prepaid unit economics comparison and channel net margin mix
A. COD vs. Prepaid Economics
Cash on Delivery (COD) remains the backbone of Indian e-commerce, but it carries higher working capital drag, customer refusal risk, and RTO expenses:B. Channel Mix Scorecard
Ranks each sales channel by its Net Sales contribution and Net Margin %:- Shopify (D2C): ₹2,69,975 net sales · 59.0% margin (Highest volume and healthy direct margin).
- Myntra: ₹1,08,160 net sales · 58.8% margin (High fashion volume with predictable commissions).
- Amazon: ₹70,587 net sales · 58.4% margin.
- Eternz: ₹47,936 net sales · 59.2% margin.
- Flipkart: ₹9,846 net sales · 59.4% margin.
5. Operations, Returns & The State Action Matrix
The bottom section of the dashboard safeguards your business against reverse-logistics bleed.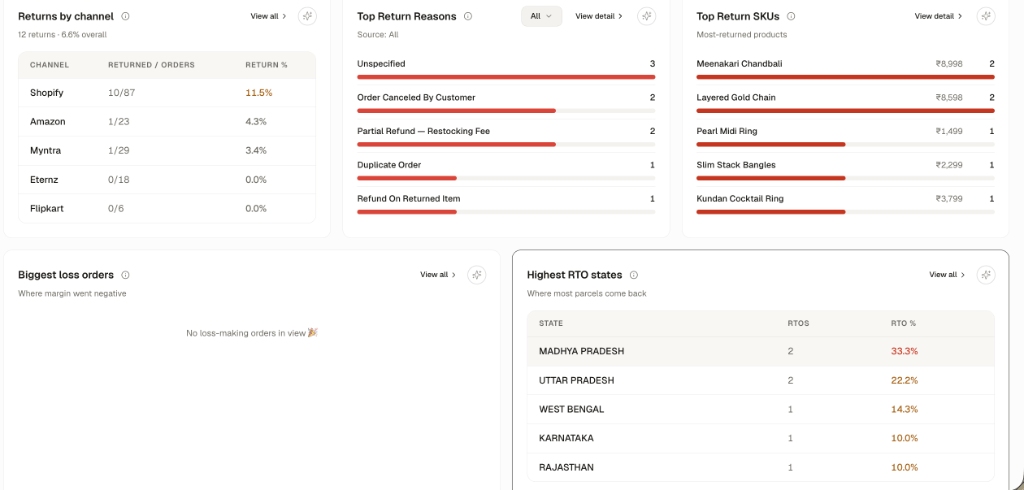
Operational intelligence: Returns by channel, top return reasons, return SKUs, and highest RTO states
A. Returns by Channel
Not all channels experience the same customer behavior. In this breakdown:- Shopify: 10 returns out of 87 orders (11.5% return rate — highlighted in amber). D2C customers often order multiple sizes or change their minds.
- Amazon: 1 return out of 23 orders (4.3% return rate).
- Myntra: 1 return out of 29 orders (3.4% return rate).
- Eternz & Flipkart: 0.0% return rate.
B. Root-Cause Analysis: Return Reasons & Top Return SKUs
- Top Return Reasons: Pinpoints why customers are sending products back (Unspecified, Customer Cancellation, Restocking Fee, Duplicate Order).
- Top Return SKUs: Identifies your highest-return individual products:
- Meenakari Chandbali: 2 returns totaling ₹8,998
- Layered Gold Chain: 2 returns totaling ₹8,598
- Pearl Midi Ring, Slim Stack Bangles, Kundan Cocktail Ring
C. Highest RTO States (State Action Matrix in Action)
Return to Origin (RTO) occurs when a courier cannot deliver a parcel (customer refused, incorrect phone number, fake address). You pay forward shipping, reverse shipping, and tie up stock:6. Interactive Features: Inline AI & Instant Drilldown
Every card on the dashboard is interactive:- The Inline AI Sparkle (
✨): Click the sparkle icon on any card to ask natural-language questions directly about that card’s data without switching to a different tab.- Examples:
- “Why did cancellations spike on September 14?”
- “Which pin codes in Madhya Pradesh caused the 33% RTO?”
- “Which ad campaign drove the COMBO category sales?”
- Examples:
- One-Click Drilldowns: Click View detail >, Open Order P&L >, or Open Scorecard > to jump straight into the full ledger backing any number.
- Date & Channel Scoping: Use the global date picker in the top-right header to switch between
Today,Last 7 days,Last 30 days, or custom accounting quarters.
7. The Founder’s 3-Minute Morning Routine
Follow this quick morning checklist to stay completely on top of your brand:1
Step 1: Check Invoiced vs Net Sales (Top Strip)
Look at the gap between Invoiced Sales and Net Sales. If the gap is widening, returns or RTOs are compounding.
2
Step 2: Review Cancellations & Returns (Sales Summary)
Check if pre-dispatch cancellations spiked yesterday. If so, inspect whether payment gateway OTPs failed or warehouse dispatch was delayed.
3
Step 3: Check COD vs. Prepaid RTO
Ensure COD RTO remains under your tolerance threshold (e.g. under 8%). If COD RTO is spiking, check which states are responsible.
4
Step 4: Inspect High-RTO States & Return SKUs
If any state exceeds 20% RTO or a specific SKU accounts for multiple returns, notify your fulfillment team to hold dispatches or require customer phone confirmation.