> ## Documentation Index
> Fetch the complete documentation index at: https://brandstack.mintlify.site/llms.txt
> Use this file to discover all available pages before exploring further.
# Marketing: Campaign Attribution, Funnels, and Audience Intelligence
> A comprehensive deep dive into Brandstack Marketing: track blended ROAS vs. platform ROAS, campaign Scale/Hold signals, conversion funnels, abandoned carts, and buyer demographics.
The **Brandstack Marketing** module gives founders and growth marketing leaders a unified command deck across paid media (**Meta Ads**, **Google Ads**), web analytics (**GA4**), and store conversions (**Shopify**).
Instead of relying on inflated in-platform ROAS numbers where Facebook and Google both claim the same sale, Brandstack reconciles **blended macro-returns (MER)** against **first-party site revenue, product views, and buyer demographics**.
 **The Attribution Dilemma:** If Meta reports ₹2.5L in sales and Google reports ₹1.5L, but your Shopify bank account only received ₹3.0L total, platform attribution is lying to you. Brandstack separates **Attributed ROAS** (what ad platforms claim) from **Blended ROAS / MER** (what actually hits your bank).
***
## 1. The Marketing Executive KPI Strip
The top strip gives you an instant read on marketing efficiency and customer acquisition economics:
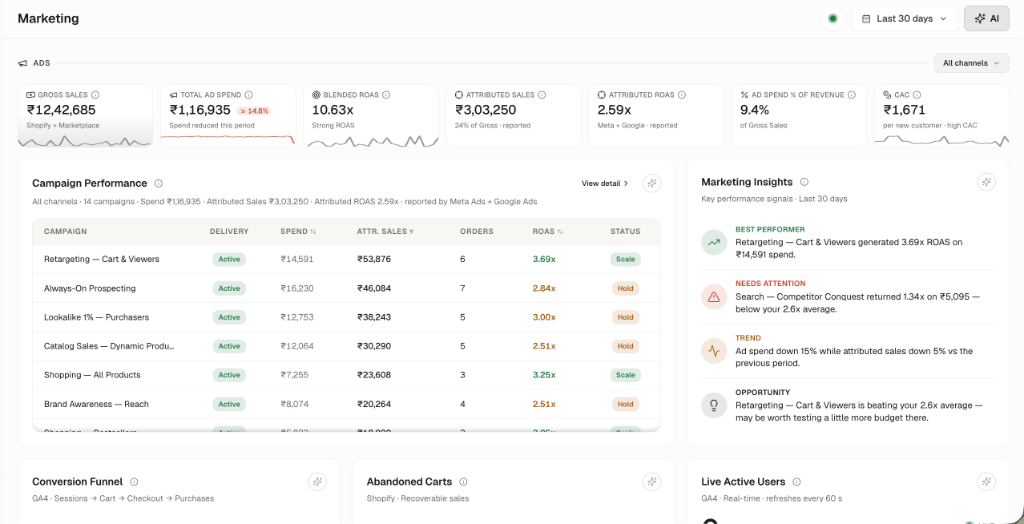
**Total store & marketplace demand** across all connected storefronts.
*Current Period:* `₹12,42,685`
**Combined ad spend** across Meta Ads and Google Ads accounts.
*Current Period:* `₹1,16,935` (`↘ 14.8%` spend reduction)
Total brand gross sales divided by total ad spend: `₹12.42L / ₹1.16L`.
*Current Period:* `10.63x` (`Strong ROAS`)
*Why it matters:* Reflects true macro marketing leverage across both direct and marketplace channels.
Direct purchase value attributed to ad clicks by Meta + Google pixels.
*Current Period:* `₹3,03,250` (**24% of Gross Sales**)
*The Lesson:* 76% of your business is driven organically, through marketplaces, or via indirect halo effects.
Direct ad efficiency reported by ad platforms: `₹3.03L / ₹1.16L`.
*Current Period:* `2.59x`
* **Marketing Load:** `9.4%` of Gross Sales (under 15% is healthy).
* **Blended CAC:** `₹1,671` per newly acquired customer (`high CAC` alert).
***
## 2. Campaign Performance & Automated Action Signals
The **Campaign Performance** table aggregates every active campaign across Meta and Google, ranking them by actual attributed sales and assigning an automated operating status (**Scale**, **Hold**, or **Cut**):
| Campaign Name | Channel / Type | Spend | Attr. Sales | Orders | ROAS | Automated Status |
| :------------------------------- | :---------------- | :------ | :---------- | :----- | :-------- | :--------------------------------------------------------------------------------------------------------------------------------------- |
| **Retargeting — Cart & Viewers** | Meta Retargeting | ₹14,591 | **₹53,876** | 6 | **3.69x** | Scale |
| **Always-On Prospecting** | Meta Broad / TOFU | ₹16,230 | ₹46,084 | 7 | **2.84x** | Hold |
| **Lookalike 1% — Purchasers** | Meta Lookalike | ₹12,753 | ₹38,243 | 5 | **3.00x** | Hold |
| **Catalog Sales — Dynamic Ads** | Meta DPA | ₹12,064 | ₹30,290 | 5 | **2.51x** | Hold |
| **Shopping — All Products** | Google Shopping | ₹7,255 | **₹23,608** | 3 | **3.25x** | Scale |
| **Brand Awareness — Reach** | Meta Reach | ₹8,074 | ₹20,264 | 4 | **2.51x** | Hold |
### Automated AI Marketing Insights (Right Panel)
Brandstack continuously evaluates your campaign roster and surfaces high-priority executive alerts:
* 📈 **Best Performer:** *"Retargeting — Cart & Viewers generated 3.69x ROAS on ₹14,591 spend."*
* ⚠️ **Needs Attention:** *"Search — Competitor Conquest returned 1.34x on ₹5,095 — below your 2.6x average."*
* 〰️ **Macro Trend:** *"Ad spend down 15% while attributed sales down only 5% vs. previous period."*
* 💡 **Immediate Opportunity:** *"Retargeting is beating your 2.6x benchmark — test a 20% budget increase here."*
***
## 3. The On-Site Conversion Funnel & Abandoned Cart Recovery
Driving traffic is only half the battle; tracking where prospective buyers abandon the funnel dictates on-site revenue efficiency:
**The Attribution Dilemma:** If Meta reports ₹2.5L in sales and Google reports ₹1.5L, but your Shopify bank account only received ₹3.0L total, platform attribution is lying to you. Brandstack separates **Attributed ROAS** (what ad platforms claim) from **Blended ROAS / MER** (what actually hits your bank).
***
## 1. The Marketing Executive KPI Strip
The top strip gives you an instant read on marketing efficiency and customer acquisition economics:
**Total store & marketplace demand** across all connected storefronts.
*Current Period:* `₹12,42,685`
**Combined ad spend** across Meta Ads and Google Ads accounts.
*Current Period:* `₹1,16,935` (`↘ 14.8%` spend reduction)
Total brand gross sales divided by total ad spend: `₹12.42L / ₹1.16L`.
*Current Period:* `10.63x` (`Strong ROAS`)
*Why it matters:* Reflects true macro marketing leverage across both direct and marketplace channels.
Direct purchase value attributed to ad clicks by Meta + Google pixels.
*Current Period:* `₹3,03,250` (**24% of Gross Sales**)
*The Lesson:* 76% of your business is driven organically, through marketplaces, or via indirect halo effects.
Direct ad efficiency reported by ad platforms: `₹3.03L / ₹1.16L`.
*Current Period:* `2.59x`
* **Marketing Load:** `9.4%` of Gross Sales (under 15% is healthy).
* **Blended CAC:** `₹1,671` per newly acquired customer (`high CAC` alert).
***
## 2. Campaign Performance & Automated Action Signals
The **Campaign Performance** table aggregates every active campaign across Meta and Google, ranking them by actual attributed sales and assigning an automated operating status (**Scale**, **Hold**, or **Cut**):
| Campaign Name | Channel / Type | Spend | Attr. Sales | Orders | ROAS | Automated Status |
| :------------------------------- | :---------------- | :------ | :---------- | :----- | :-------- | :--------------------------------------------------------------------------------------------------------------------------------------- |
| **Retargeting — Cart & Viewers** | Meta Retargeting | ₹14,591 | **₹53,876** | 6 | **3.69x** | Scale |
| **Always-On Prospecting** | Meta Broad / TOFU | ₹16,230 | ₹46,084 | 7 | **2.84x** | Hold |
| **Lookalike 1% — Purchasers** | Meta Lookalike | ₹12,753 | ₹38,243 | 5 | **3.00x** | Hold |
| **Catalog Sales — Dynamic Ads** | Meta DPA | ₹12,064 | ₹30,290 | 5 | **2.51x** | Hold |
| **Shopping — All Products** | Google Shopping | ₹7,255 | **₹23,608** | 3 | **3.25x** | Scale |
| **Brand Awareness — Reach** | Meta Reach | ₹8,074 | ₹20,264 | 4 | **2.51x** | Hold |
### Automated AI Marketing Insights (Right Panel)
Brandstack continuously evaluates your campaign roster and surfaces high-priority executive alerts:
* 📈 **Best Performer:** *"Retargeting — Cart & Viewers generated 3.69x ROAS on ₹14,591 spend."*
* ⚠️ **Needs Attention:** *"Search — Competitor Conquest returned 1.34x on ₹5,095 — below your 2.6x average."*
* 〰️ **Macro Trend:** *"Ad spend down 15% while attributed sales down only 5% vs. previous period."*
* 💡 **Immediate Opportunity:** *"Retargeting is beating your 2.6x benchmark — test a 20% budget increase here."*
***
## 3. The On-Site Conversion Funnel & Abandoned Cart Recovery
Driving traffic is only half the battle; tracking where prospective buyers abandon the funnel dictates on-site revenue efficiency:
 ### A. The 4-Stage Conversion Funnel (GA4)
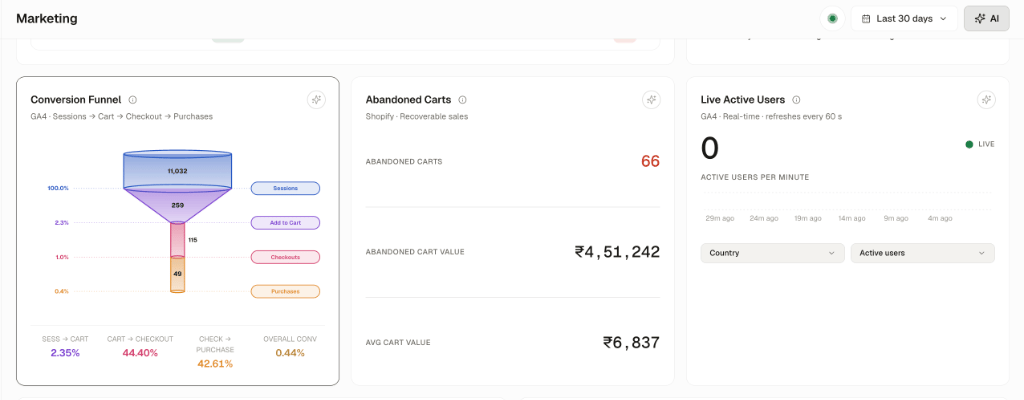
* **Stage 1: Sessions (11,032 · 100.0%)** $\longrightarrow$ Total site visits.
* **Stage 2: Add to Cart (259 · 2.3%)** $\longrightarrow$ **Session-to-Cart Conversion: 2.35%**.
* **Stage 3: Checkouts (115 · 1.0%)** $\longrightarrow$ **Cart-to-Checkout: 44.40%**.
* **Stage 4: Purchases (49 · 0.4%)** $\longrightarrow$ **Checkout-to-Purchase: 42.61%**.
* **Overall Site Conversion Rate:** **0.44%**.
**Funnel Diagnosis:** Notice that once a customer enters the checkout flow, **42.6% complete their order**, which is strong. The bottleneck is at the top of the funnel: **only 2.35% of visitors add a product to their cart**. This indicates high product curiosity but hesitation on pricing, lack of customer reviews on PDPs, or poorly communicated delivery timelines.
### B. Abandoned Carts: The Unlocked Revenue Pool
* **Abandoned Carts:** **66 carts** currently unrecovered.
* **Abandoned Cart Value:** **₹4,51,242** in pipeline revenue.
* **Average Cart Value:** **₹6,837**.
**Founder Action:** Over ₹4.5 Lakhs is abandoned in shopping carts with a high average value of ₹6,837. Deploying an automated 3-tier WhatsApp and email recovery workflow (1 hour, 12 hours with 5% discount, 24 hours with urgency) can recover 10%–15% of these carts—generating **₹45,000 to ₹67,000 in pure high-margin revenue** without spending extra ad dollars.
***
## 4. Multi-Channel Marketing Trends & Global Active Users
### A. The 4-Stage Conversion Funnel (GA4)
* **Stage 1: Sessions (11,032 · 100.0%)** $\longrightarrow$ Total site visits.
* **Stage 2: Add to Cart (259 · 2.3%)** $\longrightarrow$ **Session-to-Cart Conversion: 2.35%**.
* **Stage 3: Checkouts (115 · 1.0%)** $\longrightarrow$ **Cart-to-Checkout: 44.40%**.
* **Stage 4: Purchases (49 · 0.4%)** $\longrightarrow$ **Checkout-to-Purchase: 42.61%**.
* **Overall Site Conversion Rate:** **0.44%**.
**Funnel Diagnosis:** Notice that once a customer enters the checkout flow, **42.6% complete their order**, which is strong. The bottleneck is at the top of the funnel: **only 2.35% of visitors add a product to their cart**. This indicates high product curiosity but hesitation on pricing, lack of customer reviews on PDPs, or poorly communicated delivery timelines.
### B. Abandoned Carts: The Unlocked Revenue Pool
* **Abandoned Carts:** **66 carts** currently unrecovered.
* **Abandoned Cart Value:** **₹4,51,242** in pipeline revenue.
* **Average Cart Value:** **₹6,837**.
**Founder Action:** Over ₹4.5 Lakhs is abandoned in shopping carts with a high average value of ₹6,837. Deploying an automated 3-tier WhatsApp and email recovery workflow (1 hour, 12 hours with 5% discount, 24 hours with urgency) can recover 10%–15% of these carts—generating **₹45,000 to ₹67,000 in pure high-margin revenue** without spending extra ad dollars.
***
## 4. Multi-Channel Marketing Trends & Global Active Users
 ### A. Marketing Trend & Anomaly Alerts
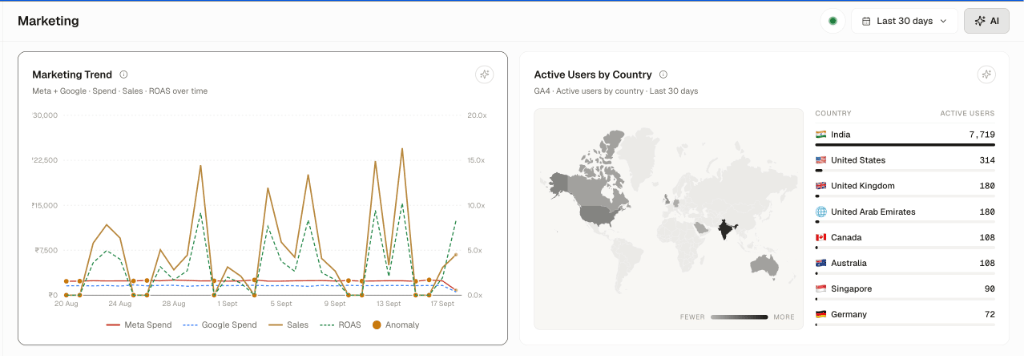
This multivariate trendline overlays:
* Solid Red Line: **Meta Spend**
* Dashed Blue Line: **Google Spend**
* Solid Gold Line: **Sales**
* Dashed Green Line: **ROAS**
* ● Orange Dots: **Detected Anomalies**
The chart exposes specific efficiency surges (e.g., September 2, 6, and 13 where ROAS spiked to 15.0x–17.5x) and flags days where ad spend spiked without an accompanying sales response.
### B. Active Users by Country (Global Demand Signals)
Highlights where international traffic originates:
1. 🇮🇳 **India:** `7,719` active users (Domestic core)
2. 🇺🇸 **United States:** `314` active users
3. 🇬🇧 **United Kingdom:** `180` active users
4. 🇦🇪 **United Arab Emirates:** `180` active users
5. 🇨🇦 **Canada:** `108` active users
6. 🇦🇺 **Australia:** `108` active users
7. 🇸🇬 **Singapore:** `90` active users
8. 🇩🇪 **Germany:** `72` active users
*Takeaway:* Over 1,000 international visitors from the US, UK, UAE, Canada, and Australia visit the store monthly. This high-purchasing-power audience is a prime opportunity for launching cross-border international shipping on your Shopify store.
***
## 5. Channel Attribution & Product Merchandising Funnel
### A. Marketing Trend & Anomaly Alerts
This multivariate trendline overlays:
* Solid Red Line: **Meta Spend**
* Dashed Blue Line: **Google Spend**
* Solid Gold Line: **Sales**
* Dashed Green Line: **ROAS**
* ● Orange Dots: **Detected Anomalies**
The chart exposes specific efficiency surges (e.g., September 2, 6, and 13 where ROAS spiked to 15.0x–17.5x) and flags days where ad spend spiked without an accompanying sales response.
### B. Active Users by Country (Global Demand Signals)
Highlights where international traffic originates:
1. 🇮🇳 **India:** `7,719` active users (Domestic core)
2. 🇺🇸 **United States:** `314` active users
3. 🇬🇧 **United Kingdom:** `180` active users
4. 🇦🇪 **United Arab Emirates:** `180` active users
5. 🇨🇦 **Canada:** `108` active users
6. 🇦🇺 **Australia:** `108` active users
7. 🇸🇬 **Singapore:** `90` active users
8. 🇩🇪 **Germany:** `72` active users
*Takeaway:* Over 1,000 international visitors from the US, UK, UAE, Canada, and Australia visit the store monthly. This high-purchasing-power audience is a prime opportunity for launching cross-border international shipping on your Shopify store.
***
## 5. Channel Attribution & Product Merchandising Funnel
 ### A. Channel Performance Comparison (GA4 + Ad Spend)
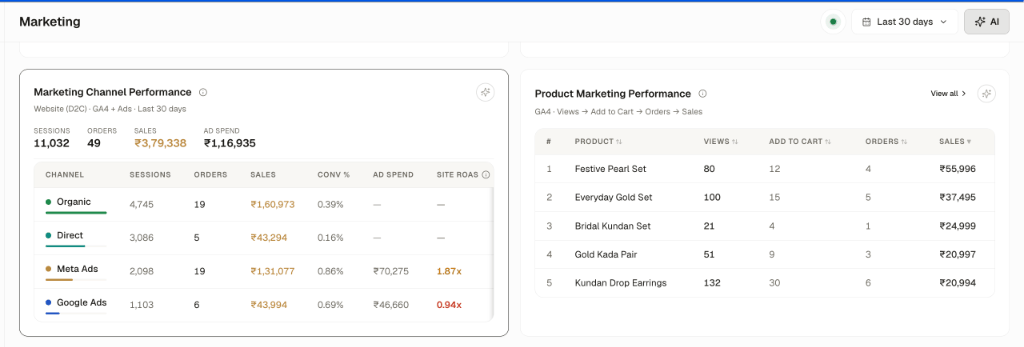
| Channel | Sessions | Orders | Sales | Conv % | Ad Spend | Direct Site ROAS |
| :----------------- | :------- | :----- | :------------ | :-------- | :------- | :--------------------- |
| **Organic Search** | 4,745 | 19 | **₹1,60,973** | 0.39% | — | — (Zero CAC) |
| **Direct Visits** | 3,086 | 5 | **₹43,294** | 0.16% | — | — (Brand Equity) |
| **Meta Ads** | 2,098 | 19 | **₹1,31,077** | **0.86%** | ₹70,275 | **1.87x** |
| **Google Ads** | 1,103 | 6 | **₹43,994** | 0.69% | ₹46,660 | **0.94x** (Below 1.0x) |
**The Google Ads Audit:** Notice that on direct website attribution, **Google Ads generated a 0.94x Site ROAS** (spent ₹46,660 to make ₹43,994). However, Google Ads often drives high-intent shoppers who end up buying on Amazon. Before pausing Google campaigns, cross-reference whether your Amazon search sales rise or fall when Google spend is modified.
### B. Product Marketing Performance (Merchandising Funnel)
Tracks how individual catalog items perform from traffic view to checkout:
1. **Festive Pearl Set:** 80 views $\rightarrow$ 12 carts $\rightarrow$ 4 orders $\rightarrow$ **₹55,996 sales** (Hero high-ticket earner).
2. **Everyday Gold Set:** 100 views $\rightarrow$ 15 carts $\rightarrow$ 5 orders $\rightarrow$ **₹37,495 sales**.
3. **Bridal Kundan Set:** 21 views $\rightarrow$ 4 carts $\rightarrow$ 1 order $\rightarrow$ **₹24,999 sales**.
4. **Gold Kada Pair:** 51 views $\rightarrow$ 9 carts $\rightarrow$ 3 orders $\rightarrow$ **₹20,997 sales**.
5. **Kundan Drop Earrings:** **132 views** $\rightarrow$ **30 add to carts (22.7% cart rate!)** $\rightarrow$ 6 orders $\rightarrow$ **₹20,994 sales**.
*Catalog Strategy:* *Kundan Drop Earrings* has the highest intent-to-cart rate (22.7%). It is your best "entry-level" product to feature in Meta top-of-funnel ads to get first-time buyers through the door.
***
## 6. Top Delivery Cities, Page Analytics & Buyer Demographics
### A. Channel Performance Comparison (GA4 + Ad Spend)
| Channel | Sessions | Orders | Sales | Conv % | Ad Spend | Direct Site ROAS |
| :----------------- | :------- | :----- | :------------ | :-------- | :------- | :--------------------- |
| **Organic Search** | 4,745 | 19 | **₹1,60,973** | 0.39% | — | — (Zero CAC) |
| **Direct Visits** | 3,086 | 5 | **₹43,294** | 0.16% | — | — (Brand Equity) |
| **Meta Ads** | 2,098 | 19 | **₹1,31,077** | **0.86%** | ₹70,275 | **1.87x** |
| **Google Ads** | 1,103 | 6 | **₹43,994** | 0.69% | ₹46,660 | **0.94x** (Below 1.0x) |
**The Google Ads Audit:** Notice that on direct website attribution, **Google Ads generated a 0.94x Site ROAS** (spent ₹46,660 to make ₹43,994). However, Google Ads often drives high-intent shoppers who end up buying on Amazon. Before pausing Google campaigns, cross-reference whether your Amazon search sales rise or fall when Google spend is modified.
### B. Product Marketing Performance (Merchandising Funnel)
Tracks how individual catalog items perform from traffic view to checkout:
1. **Festive Pearl Set:** 80 views $\rightarrow$ 12 carts $\rightarrow$ 4 orders $\rightarrow$ **₹55,996 sales** (Hero high-ticket earner).
2. **Everyday Gold Set:** 100 views $\rightarrow$ 15 carts $\rightarrow$ 5 orders $\rightarrow$ **₹37,495 sales**.
3. **Bridal Kundan Set:** 21 views $\rightarrow$ 4 carts $\rightarrow$ 1 order $\rightarrow$ **₹24,999 sales**.
4. **Gold Kada Pair:** 51 views $\rightarrow$ 9 carts $\rightarrow$ 3 orders $\rightarrow$ **₹20,997 sales**.
5. **Kundan Drop Earrings:** **132 views** $\rightarrow$ **30 add to carts (22.7% cart rate!)** $\rightarrow$ 6 orders $\rightarrow$ **₹20,994 sales**.
*Catalog Strategy:* *Kundan Drop Earrings* has the highest intent-to-cart rate (22.7%). It is your best "entry-level" product to feature in Meta top-of-funnel ads to get first-time buyers through the door.
***
## 6. Top Delivery Cities, Page Analytics & Buyer Demographics
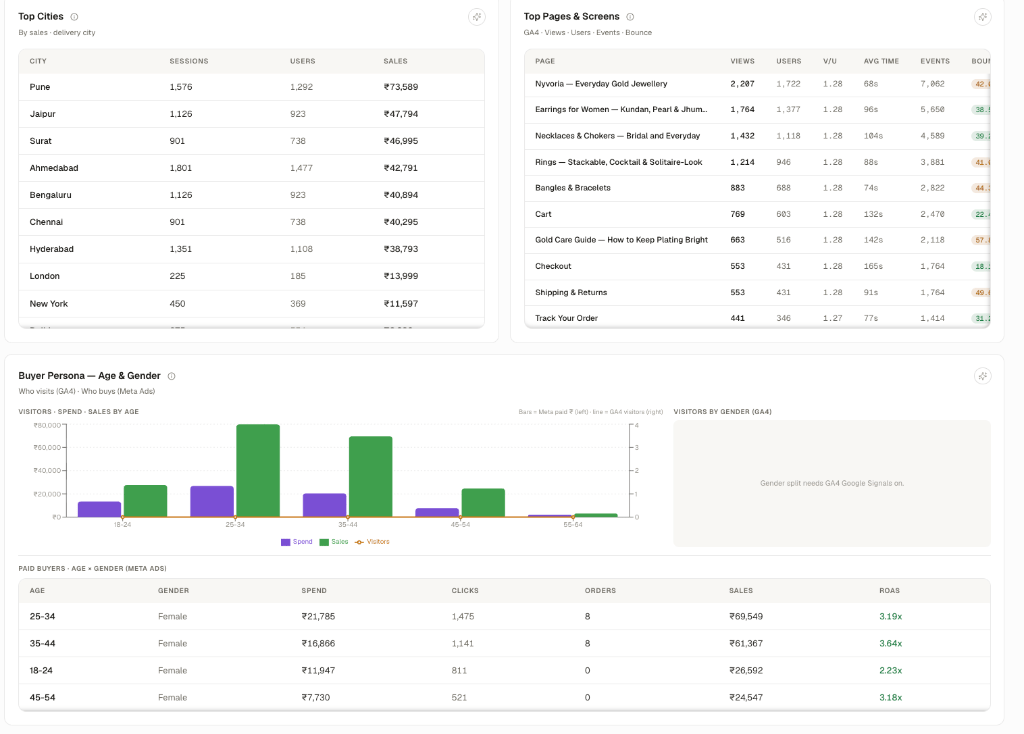 ### A. Top Delivery Cities by Realized Sales
* **Pune:** 1,576 sessions · **₹73,589 sales** (#1 Revenue city)
* **Jaipur:** 1,126 sessions · **₹47,794 sales**
* **Surat:** 901 sessions · **₹46,995 sales**
* **Ahmedabad:** 1,801 sessions · **₹42,791 sales**
* **Bengaluru:** 1,126 sessions · **₹40,894 sales**
* **London & New York:** Combined ₹25K+ in international direct revenue.
### B. Buyer Persona: Age & Gender Economics (Meta Ads)
Who actually buys your jewelry and accessories?
| Age Bracket | Gender | Ad Spend | Clicks | Orders | Attributed Sales | Realized ROAS |
| :---------- | :----- | :------- | :----- | :------- | :--------------- | :----------------------- |
| **25–34** | Female | ₹21,785 | 1,475 | 8 | **₹69,549** | **3.19x** |
| **35–44** | Female | ₹16,866 | 1,141 | 8 | **₹61,367** | **3.64x** (Highest ROI!) |
| **18–24** | Female | ₹11,947 | 811 | 0 direct | ₹26,592 | **2.23x** |
| **45–54** | Female | ₹7,730 | 521 | 0 direct | ₹24,547 | **3.18x** |
**Demographic Allocation Playbook:**
* Women aged **25 to 44** generate over **70% of total revenue at \~3.4x average ROAS**.
* The **35–44 age bracket** produces the highest return on ad spend (**3.64x**).
* Reallocate ad budget away from 18–24 prospecting ads and double down on creative styling geared toward working women and wedding attendees aged 25–44.
***
## 7. The Growth Marketer's Weekly Playbook
Check campaigns tagged with Scale. Increase daily budgets by 15%–20% incrementally on winners like *Retargeting — Cart & Viewers*.
Check Google Ads and TOFU prospecting campaigns. If direct Site ROAS is below 1.0x, verify if branded search terms or competitor conquesting campaigns are burning cash.
Ensure automated WhatsApp and email abandoned checkout sequences are functioning to recover part of the ₹4.5L pipeline value.
Focus ad creatives on the 25–44 female demographic who generate the bulk of purchases and command the highest AOV.
### A. Top Delivery Cities by Realized Sales
* **Pune:** 1,576 sessions · **₹73,589 sales** (#1 Revenue city)
* **Jaipur:** 1,126 sessions · **₹47,794 sales**
* **Surat:** 901 sessions · **₹46,995 sales**
* **Ahmedabad:** 1,801 sessions · **₹42,791 sales**
* **Bengaluru:** 1,126 sessions · **₹40,894 sales**
* **London & New York:** Combined ₹25K+ in international direct revenue.
### B. Buyer Persona: Age & Gender Economics (Meta Ads)
Who actually buys your jewelry and accessories?
| Age Bracket | Gender | Ad Spend | Clicks | Orders | Attributed Sales | Realized ROAS |
| :---------- | :----- | :------- | :----- | :------- | :--------------- | :----------------------- |
| **25–34** | Female | ₹21,785 | 1,475 | 8 | **₹69,549** | **3.19x** |
| **35–44** | Female | ₹16,866 | 1,141 | 8 | **₹61,367** | **3.64x** (Highest ROI!) |
| **18–24** | Female | ₹11,947 | 811 | 0 direct | ₹26,592 | **2.23x** |
| **45–54** | Female | ₹7,730 | 521 | 0 direct | ₹24,547 | **3.18x** |
**Demographic Allocation Playbook:**
* Women aged **25 to 44** generate over **70% of total revenue at \~3.4x average ROAS**.
* The **35–44 age bracket** produces the highest return on ad spend (**3.64x**).
* Reallocate ad budget away from 18–24 prospecting ads and double down on creative styling geared toward working women and wedding attendees aged 25–44.
***
## 7. The Growth Marketer's Weekly Playbook
Check campaigns tagged with Scale. Increase daily budgets by 15%–20% incrementally on winners like *Retargeting — Cart & Viewers*.
Check Google Ads and TOFU prospecting campaigns. If direct Site ROAS is below 1.0x, verify if branded search terms or competitor conquesting campaigns are burning cash.
Ensure automated WhatsApp and email abandoned checkout sequences are functioning to recover part of the ₹4.5L pipeline value.
Focus ad creatives on the 25–44 female demographic who generate the bulk of purchases and command the highest AOV.