> ## Documentation Index
> Fetch the complete documentation index at: https://brandstack.mintlify.site/llms.txt
> Use this file to discover all available pages before exploring further.
# Instagram: Organic Reach, Content Performance, and Audience Intelligence
> A comprehensive deep dive into Brandstack Instagram: track organic follower growth, engagement rates, buy-intent saves, Reels vs. Feed format effectiveness, and demographic breakdowns.
The **Brandstack Instagram** module bridges the gap between organic social storytelling and e-commerce revenue. For modern consumer brands, Instagram is not just a brand gallery—it is your **primary product discovery engine, community hub, and unpaid traffic driver**.
While native Instagram Insights hides historical data and fragments analytics across individual posts, Brandstack aggregates your **organic reach, follower growth trajectories, post/reel performance, story retention, and follower demographics** into one command center.
 **The Organic Halo Effect:** Paid ads rent an audience; organic Instagram builds an asset. Tracking **Saves** and **Average Reel Watch Time** gives growth teams advance warning on which styles and designs will sell out before running paid ads.
***
## 1. Top Instagram KPI Strip
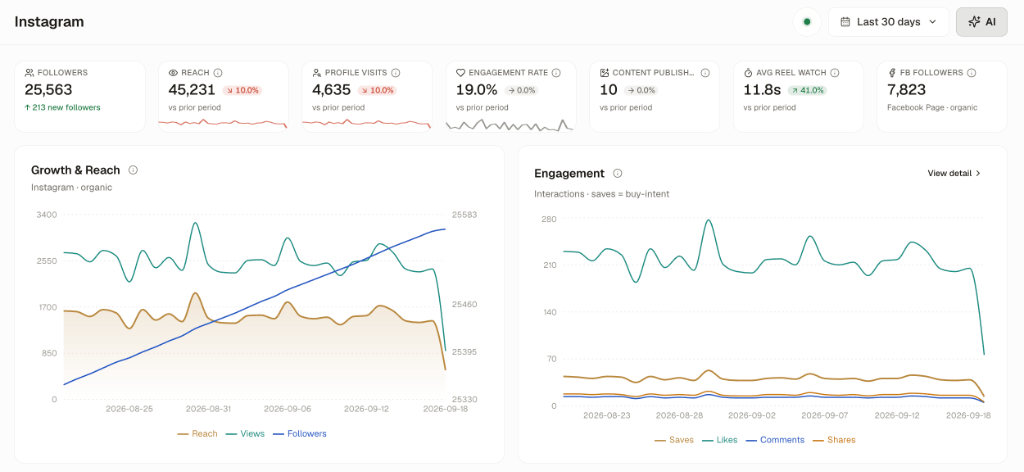
The top executive strip monitors audience accumulation and audience attention:
**Total follower count:** `25,563`
*Net Growth:* `↑ 213 new followers` over the selected 30 days.
Unique accounts that viewed your posts, stories, or reels.
*Current Period:* `45,231` (`↘ 10.0%` vs prior period)
Users who clicked through to your profile after seeing content.
*Current Period:* `4,635` (`↘ 10.0%`)
*Why it matters:* Profile visits represent high purchase intent—this is where users click your link-in-bio to visit your Shopify store.
Total interactions divided by total reach: `19.0%` (`→ 0.0%`).
*Benchmark:* Typical e-commerce Instagram accounts average 1.5%–3.0%. A **19.0% engagement rate** indicates an exceptionally active, loyal customer base.
Total output in the 30-day window: `10 items` (`→ 0.0%`).
*Cadence:* Measures creative publishing velocity across feed posts and reels.
* **Average Reel Watch:** `11.8s` (`↗ 41.0%` improvement).
* **Facebook Page Followers:** `7,823` organic followers.
***
## 2. Organic Growth & The "Saves = Buy-Intent" Framework
The top dual charts plot audience expansion against real customer engagement:
### A. Growth & Reach (Instagram · Organic)
* **Dual Y-Axis Visualizer:** Plots daily **Reach (gold filled area)** and **Views/Impressions (green curve)** on the left axis against cumulative **Followers (blue upward curve)** on the right axis.
* **Trajectory:** Follower count demonstrates a smooth, sustained climb from 25,350 to 25,563.
* **Diagnostic Value:** Spikes in reach (e.g. August 29 and September 14) correspond to viral reel distribution that pulls in fresh non-follower discovery.
### B. Engagement Breakdown: Why "Saves = Buy-Intent"
The **Engagement** chart tracks 4 distinct interaction types:
| Interaction Type | Indicator | Daily Volume | Strategic E-Commerce Meaning |
| :--------------- | :---------------------------------------------------------------------- | :---------------- | :-------------------------------------------------------------------------------------------------------------------------- |
| **Likes** | Green Line | 200 – 280 / day | Passive brand appreciation. Easy to give, low commercial signal. |
| **Saves** | Gold Line | **35 – 55 / day** | 🚨 **High Purchase Intent:** Customers save jewelry/fashion items to purchase later during festivals, weddings, or paydays. |
| **Comments** | Blue Line | 10 – 25 / day | Direct customer inquiries (*"Price?", "Is this silver?", "Restock date?"*). |
| **Shares** | Orange Line | 10 – 25 / day | Word-of-mouth amplification (sharing with friends or spouses). |
**The Founder's Merchandising Rule:** When a post or reel receives an abnormally high **Save-to-Like ratio** (e.g. over 20%), that product is primed for commercial conversion. Immediately feature that SKU on your Shopify homepage and prioritize warehouse inventory.
***
## 3. Content Performance Grid: Post & Reel Leaderboard
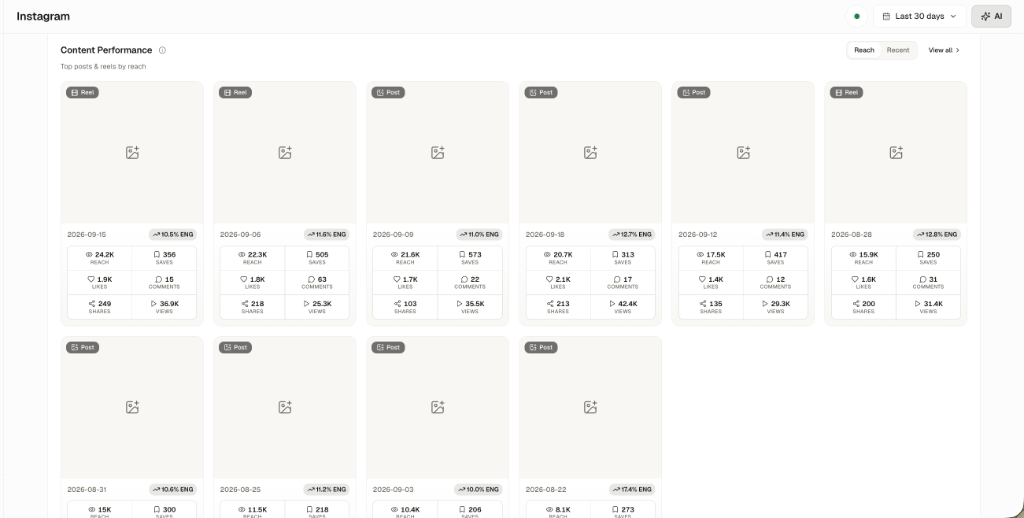
The **Content Performance** module ranks individual posts and reels by total organic reach, displaying key engagement metrics directly on the creative card:
**The Organic Halo Effect:** Paid ads rent an audience; organic Instagram builds an asset. Tracking **Saves** and **Average Reel Watch Time** gives growth teams advance warning on which styles and designs will sell out before running paid ads.
***
## 1. Top Instagram KPI Strip
The top executive strip monitors audience accumulation and audience attention:
**Total follower count:** `25,563`
*Net Growth:* `↑ 213 new followers` over the selected 30 days.
Unique accounts that viewed your posts, stories, or reels.
*Current Period:* `45,231` (`↘ 10.0%` vs prior period)
Users who clicked through to your profile after seeing content.
*Current Period:* `4,635` (`↘ 10.0%`)
*Why it matters:* Profile visits represent high purchase intent—this is where users click your link-in-bio to visit your Shopify store.
Total interactions divided by total reach: `19.0%` (`→ 0.0%`).
*Benchmark:* Typical e-commerce Instagram accounts average 1.5%–3.0%. A **19.0% engagement rate** indicates an exceptionally active, loyal customer base.
Total output in the 30-day window: `10 items` (`→ 0.0%`).
*Cadence:* Measures creative publishing velocity across feed posts and reels.
* **Average Reel Watch:** `11.8s` (`↗ 41.0%` improvement).
* **Facebook Page Followers:** `7,823` organic followers.
***
## 2. Organic Growth & The "Saves = Buy-Intent" Framework
The top dual charts plot audience expansion against real customer engagement:
### A. Growth & Reach (Instagram · Organic)
* **Dual Y-Axis Visualizer:** Plots daily **Reach (gold filled area)** and **Views/Impressions (green curve)** on the left axis against cumulative **Followers (blue upward curve)** on the right axis.
* **Trajectory:** Follower count demonstrates a smooth, sustained climb from 25,350 to 25,563.
* **Diagnostic Value:** Spikes in reach (e.g. August 29 and September 14) correspond to viral reel distribution that pulls in fresh non-follower discovery.
### B. Engagement Breakdown: Why "Saves = Buy-Intent"
The **Engagement** chart tracks 4 distinct interaction types:
| Interaction Type | Indicator | Daily Volume | Strategic E-Commerce Meaning |
| :--------------- | :---------------------------------------------------------------------- | :---------------- | :-------------------------------------------------------------------------------------------------------------------------- |
| **Likes** | Green Line | 200 – 280 / day | Passive brand appreciation. Easy to give, low commercial signal. |
| **Saves** | Gold Line | **35 – 55 / day** | 🚨 **High Purchase Intent:** Customers save jewelry/fashion items to purchase later during festivals, weddings, or paydays. |
| **Comments** | Blue Line | 10 – 25 / day | Direct customer inquiries (*"Price?", "Is this silver?", "Restock date?"*). |
| **Shares** | Orange Line | 10 – 25 / day | Word-of-mouth amplification (sharing with friends or spouses). |
**The Founder's Merchandising Rule:** When a post or reel receives an abnormally high **Save-to-Like ratio** (e.g. over 20%), that product is primed for commercial conversion. Immediately feature that SKU on your Shopify homepage and prioritize warehouse inventory.
***
## 3. Content Performance Grid: Post & Reel Leaderboard
The **Content Performance** module ranks individual posts and reels by total organic reach, displaying key engagement metrics directly on the creative card:
 ### Top Performer Breakdown:
1. **Reel (Sept 15):** `10.5% ENG` · **24.2K Reach** · 356 Saves · 1.9K Likes · 15 Comments · 249 Shares · **36.9K Views**
2. **Reel (Sept 06):** `11.6% ENG` · **22.3K Reach** · **505 Saves** · 1.8K Likes · 63 Comments · 218 Shares · 25.3K Views
3. **Static Post (Sept 09):** `11.0% ENG` · **21.6K Reach** · **573 Saves** (`#1 Highest Saves!`) · 1.7K Likes · 35.5K Views
4. **Post (Sept 18):** `12.7% ENG` · **20.7K Reach** · 313 Saves · 2.1K Likes · **42.4K Views** (`#1 Highest Views`)
5. **Post (Sept 12):** `11.4% ENG` · **17.5K Reach** · 417 Saves · 1.4K Likes · 29.3K Views
6. **Reel (Aug 28):** `12.8% ENG` · **15.9K Reach** · 250 Saves · 1.6K Likes · 200 Shares · 31.4K Views
**Post Format Insight:** While **Reels** consistently capture high impressions (up to 42.4K views), **Static Carousel Posts** generate the largest volume of saves (573 saves on a single post). Use Reels for broad discovery and static carousels for detailed styling and product specs.
***
## 4. Format Effectiveness, Stories & Audience Demographics
### Top Performer Breakdown:
1. **Reel (Sept 15):** `10.5% ENG` · **24.2K Reach** · 356 Saves · 1.9K Likes · 15 Comments · 249 Shares · **36.9K Views**
2. **Reel (Sept 06):** `11.6% ENG` · **22.3K Reach** · **505 Saves** · 1.8K Likes · 63 Comments · 218 Shares · 25.3K Views
3. **Static Post (Sept 09):** `11.0% ENG` · **21.6K Reach** · **573 Saves** (`#1 Highest Saves!`) · 1.7K Likes · 35.5K Views
4. **Post (Sept 18):** `12.7% ENG` · **20.7K Reach** · 313 Saves · 2.1K Likes · **42.4K Views** (`#1 Highest Views`)
5. **Post (Sept 12):** `11.4% ENG` · **17.5K Reach** · 417 Saves · 1.4K Likes · 29.3K Views
6. **Reel (Aug 28):** `12.8% ENG` · **15.9K Reach** · 250 Saves · 1.6K Likes · 200 Shares · 31.4K Views
**Post Format Insight:** While **Reels** consistently capture high impressions (up to 42.4K views), **Static Carousel Posts** generate the largest volume of saves (573 saves on a single post). Use Reels for broad discovery and static carousels for detailed styling and product specs.
***
## 4. Format Effectiveness, Stories & Audience Demographics
 ### A. Reels vs. Feed: Format Effectiveness
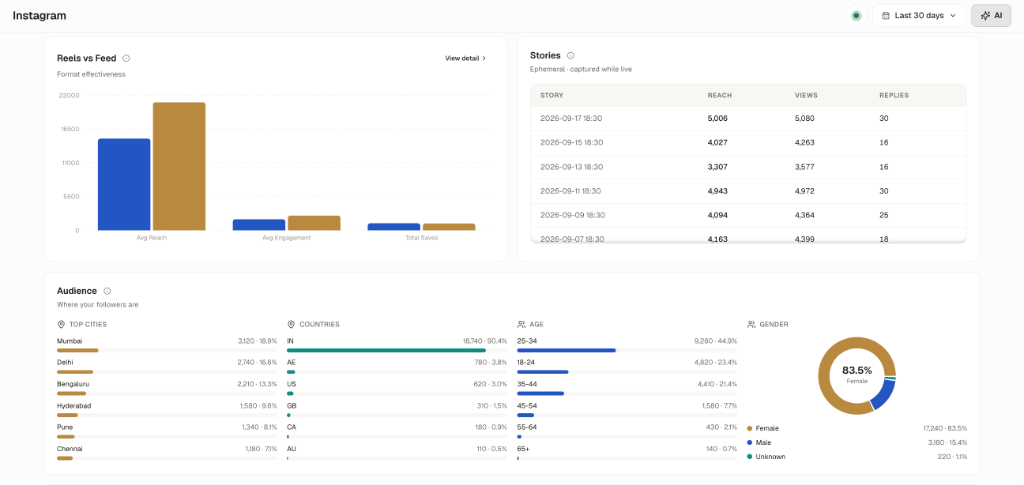
A direct comparative bar chart comparing **Reels (brown bars)** against **Feed Posts (blue bars)**:
* **Average Reach:** Reels average **\~21,000 reach** per asset vs. Feed posts at **\~14,500 reach** (Reels deliver **\~45% more top-of-funnel reach**).
* **Average Engagement:** Reels drive \~2,200 engagements vs. \~1,800 for Feed posts.
* **Total Saves:** Both formats tie closely (\~450–500 saves), proving that well-photographed static imagery is equally effective at driving purchase intent.
### B. Stories (Ephemeral · Captured While Live)
Instagram Stories expire after 24 hours in the native app, making long-term performance tracking difficult. Brandstack automatically records story analytics upon publication:
| Story Date & Time | Reach | Views | DM Replies | Strategic Use Case |
| :------------------- | :-------- | :---- | :------------- | :--------------------------------------------------- |
| **2026-09-17 18:30** | **5,006** | 5,080 | **30 Replies** | Evening product showcase. High conversation starter. |
| **2026-09-15 18:30** | 4,027 | 4,263 | 16 Replies | Behind-the-scenes / packaging clip. |
| **2026-09-13 18:30** | 3,307 | 3,577 | 16 Replies | Weekend reminder. |
| **2026-09-11 18:30** | 4,943 | 4,972 | **30 Replies** | Flash collection launch. |
| **2026-09-09 18:30** | 4,094 | 4,364 | 25 Replies | Customer review repost. |
*Takeaway:* Your active stories reach a dedicated, high-intent core of **4,000 to 5,000 followers** with direct reply rates reaching 30 DMs per story. This is your premier channel for exclusive discount drops and VIP pre-orders.
***
## 5. Audience Demographics: Geographic & Gender Truth
Understanding who follows your Instagram dictates your product design, pricing, and paid ad targeting:
### A. Top Cities
1. **Mumbai:** `3,120` followers (**18.9%**)
2. **Delhi:** `2,740` followers (**16.6%**)
3. **Bengaluru:** `2,210` followers (**13.3%**)
4. **Hyderabad:** `1,580` followers (**9.6%**)
5. **Pune:** `1,340` followers (**8.1%**)
6. **Chennai:** `1,180` followers (**7.1%**)
### B. International Reach & Countries
* 🇮🇳 **India:** `18,740` (**90.4%**)
* 🇦🇪 **UAE:** `780` (**3.8%**)
* 🇺🇸 **United States:** `620` (**3.0%**)
* 🇬🇧 **United Kingdom:** `310` (**1.5%**)
* 🇨🇦 **Canada & Australia:** `290` followers
### C. Age & Gender Distribution
* **Gender:** **83.5% Female** (17,240 followers) vs. **15.4% Male** (3,180 followers).
* **Age Brackets:**
* **25–34:** **44.9% (9,260 followers)** — The core affluent buying demographic.
* **18–24:** **23.4% (4,820 followers)** — College & early career trend-followers.
* **35–44:** **21.4% (4,410 followers)** — Premium luxury buyers.
* **45+:** **9.8% (2,010 followers)**.
**Paid Ad Synergies:** Your organic follower demographic (**83.5% female, 66.3% aged 25–44**) directly mirrors the highest-ROAS buyer persona discovered in the [Marketing module](/guides/features/marketing). Ensure all paid lookalike audiences and Meta interest sets are strictly pegged to this demographic.
***
## 6. Facebook Page Integration Status
### A. Reels vs. Feed: Format Effectiveness
A direct comparative bar chart comparing **Reels (brown bars)** against **Feed Posts (blue bars)**:
* **Average Reach:** Reels average **\~21,000 reach** per asset vs. Feed posts at **\~14,500 reach** (Reels deliver **\~45% more top-of-funnel reach**).
* **Average Engagement:** Reels drive \~2,200 engagements vs. \~1,800 for Feed posts.
* **Total Saves:** Both formats tie closely (\~450–500 saves), proving that well-photographed static imagery is equally effective at driving purchase intent.
### B. Stories (Ephemeral · Captured While Live)
Instagram Stories expire after 24 hours in the native app, making long-term performance tracking difficult. Brandstack automatically records story analytics upon publication:
| Story Date & Time | Reach | Views | DM Replies | Strategic Use Case |
| :------------------- | :-------- | :---- | :------------- | :--------------------------------------------------- |
| **2026-09-17 18:30** | **5,006** | 5,080 | **30 Replies** | Evening product showcase. High conversation starter. |
| **2026-09-15 18:30** | 4,027 | 4,263 | 16 Replies | Behind-the-scenes / packaging clip. |
| **2026-09-13 18:30** | 3,307 | 3,577 | 16 Replies | Weekend reminder. |
| **2026-09-11 18:30** | 4,943 | 4,972 | **30 Replies** | Flash collection launch. |
| **2026-09-09 18:30** | 4,094 | 4,364 | 25 Replies | Customer review repost. |
*Takeaway:* Your active stories reach a dedicated, high-intent core of **4,000 to 5,000 followers** with direct reply rates reaching 30 DMs per story. This is your premier channel for exclusive discount drops and VIP pre-orders.
***
## 5. Audience Demographics: Geographic & Gender Truth
Understanding who follows your Instagram dictates your product design, pricing, and paid ad targeting:
### A. Top Cities
1. **Mumbai:** `3,120` followers (**18.9%**)
2. **Delhi:** `2,740` followers (**16.6%**)
3. **Bengaluru:** `2,210` followers (**13.3%**)
4. **Hyderabad:** `1,580` followers (**9.6%**)
5. **Pune:** `1,340` followers (**8.1%**)
6. **Chennai:** `1,180` followers (**7.1%**)
### B. International Reach & Countries
* 🇮🇳 **India:** `18,740` (**90.4%**)
* 🇦🇪 **UAE:** `780` (**3.8%**)
* 🇺🇸 **United States:** `620` (**3.0%**)
* 🇬🇧 **United Kingdom:** `310` (**1.5%**)
* 🇨🇦 **Canada & Australia:** `290` followers
### C. Age & Gender Distribution
* **Gender:** **83.5% Female** (17,240 followers) vs. **15.4% Male** (3,180 followers).
* **Age Brackets:**
* **25–34:** **44.9% (9,260 followers)** — The core affluent buying demographic.
* **18–24:** **23.4% (4,820 followers)** — College & early career trend-followers.
* **35–44:** **21.4% (4,410 followers)** — Premium luxury buyers.
* **45+:** **9.8% (2,010 followers)**.
**Paid Ad Synergies:** Your organic follower demographic (**83.5% female, 66.3% aged 25–44**) directly mirrors the highest-ROAS buyer persona discovered in the [Marketing module](/guides/features/marketing). Ensure all paid lookalike audiences and Meta interest sets are strictly pegged to this demographic.
***
## 6. Facebook Page Integration Status
 Brandstack also includes a dedicated connector for your **Facebook Page**. When connected, it surfaces:
* Total organic Facebook Page likes and followers (e.g. 7,823 followers).
* Cross-posted reels and video watch times.
* Comments and sentiment from Facebook's older demographic.
***
## 7. The Social Commerce Weekly Workflow
Filter the **Content Performance** grid by `Reach` and identify the top 3 posts with the most saves. Note the featured SKUs.
Take your top-performing organic reels (those with over 10% engagement and 20K+ reach) and whitelist them as Meta Ads. Organic winners almost always outperform studio-produced ads in paid feeds.
Keep an active story schedule at peak engagement hours (e.g. 18:30) to consistently harvest 25–30 direct customer inquiries per story.
Ensure fast courier delivery coverage across Mumbai, Delhi, Bengaluru, and Hyderabad, which together house over 58% of your brand's audience.
Brandstack also includes a dedicated connector for your **Facebook Page**. When connected, it surfaces:
* Total organic Facebook Page likes and followers (e.g. 7,823 followers).
* Cross-posted reels and video watch times.
* Comments and sentiment from Facebook's older demographic.
***
## 7. The Social Commerce Weekly Workflow
Filter the **Content Performance** grid by `Reach` and identify the top 3 posts with the most saves. Note the featured SKUs.
Take your top-performing organic reels (those with over 10% engagement and 20K+ reach) and whitelist them as Meta Ads. Organic winners almost always outperform studio-produced ads in paid feeds.
Keep an active story schedule at peak engagement hours (e.g. 18:30) to consistently harvest 25–30 direct customer inquiries per story.
Ensure fast courier delivery coverage across Mumbai, Delhi, Bengaluru, and Hyderabad, which together house over 58% of your brand's audience.