> ## Documentation Index
> Fetch the complete documentation index at: https://brandstack.mintlify.site/llms.txt
> Use this file to discover all available pages before exploring further.
# Morning Command Center: Complete Dashboard Guide
> A comprehensive deep dive into the Brandstack Dashboard: understand gross-to-net waterfalls, COD vs. prepaid unit economics, channel profitability, and RTO risk.
The **Brandstack Dashboard** is engineered to be the single command center a D2C founder or operator checks first every morning. Instead of opening 8 to 12 separate portals—Shopify, Meta Ads, Amazon Seller Central, Flipkart Seller Hub, Myntra PPMP, and courier dashboards—Brandstack reconciles all your channels into one live, unified view.
 **The 8:00 AM Rule:** Most founders lose 1 to 2 hours every morning cross-referencing mismatched spreadsheets. The Brandstack dashboard is built so you can assess top-line revenue, true bank margin, cash collection risk, and operational fires in under **3 minutes**.
***
## 1. Top KPI Strip: The True Health of Your Brand
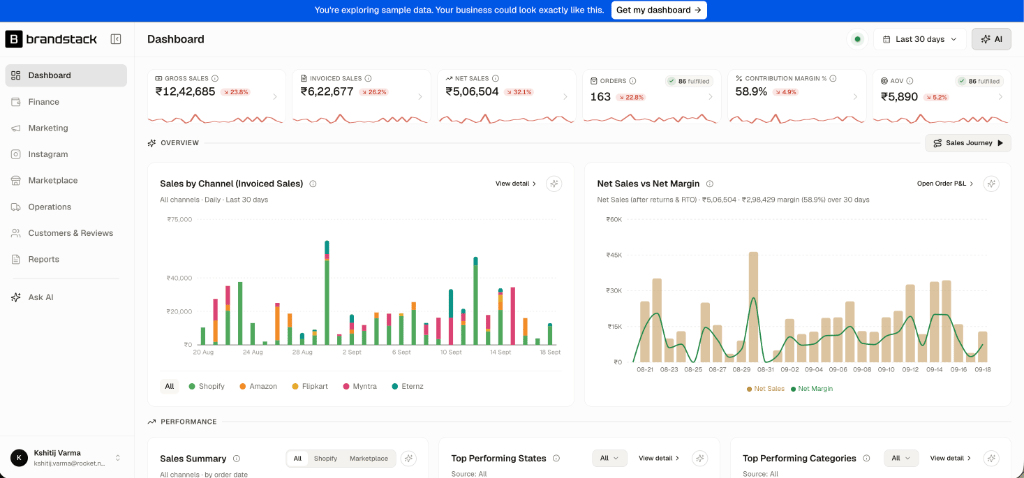
At the top of your dashboard sits the 6-metric executive health strip. In e-commerce, **headline revenue is vanity, invoiced sales is reality, and net margin is survival**. Brandstack displays this 3-tier truth side by side:
**Total value of all orders placed**, before any customer discounts, cancellations, or returns.
*Why it matters:* Tells you total market demand and top-of-funnel checkout volume.
**Actual billed revenue** generated from orders that were successfully confirmed and packed.
*Formula:* `Gross Sales − Discounts − Pre-Dispatch Cancellations`
**Cash kept by your business** after accounting for customer returns and RTOs (Return to Origin).
*Formula:* `Invoiced Sales − Customer Returns − RTO Orders`
Shows total orders placed alongside the count of orders **already fulfilled and dispatched** by your warehouse.
*Why it matters:* Instantly flags dispatch backlogs before shipping SLAs breach.
The percentage of revenue that lands in your bank after covering **COGS, shipping, packaging, and payment fees**.
*Why it matters:* If this drops below your target (e.g., 50%), scaling ad spend will burn cash.
Average net transaction size across all channels.
*Why it matters:* Higher AOV gives your marketing team breathing room against rising ad CPMs.
Every KPI card includes a **real-time sparkline** and a **percentage change indicator** comparing the current period (e.g., `Last 30 days`) to the previous period. A red indicator (`↘`) flags areas requiring attention, while green (`↗`) signals positive growth.
***
## 2. Overview: Daily Velocity & Profit Alignment
Directly below the KPI strip, the **Overview** section contrasts top-line channel volume against actual net margin.
### A. Sales by Channel (Invoiced Sales)
This interactive, stacked bar chart maps your daily invoiced revenue across every storefront and marketplace:
* **Shopify (D2C Store)** — Direct web sales
* **Amazon** — Seller Central orders
* **Flipkart** — Seller Hub orders
* **Myntra** — PPMP orders
* **Eternz** — Partner marketplace sales
**What to look for:** Look for spikes and channel concentration. If Shopify spikes on a weekend while marketplaces stay flat, evaluate whether your D2C ad spend cannibalized marketplace organic discovery or if a specific influencer campaign drove direct traffic.
### B. Net Sales vs Net Margin
This dual-axis visualizer plots **Net Sales (tan vertical bars)** against **Net Margin (green line overlay)**:
* **The Insight:** High sales days do not always equal high profit days. If Net Sales shoots up by 2× on a promotion day but the Net Margin curve stays flat or dips, you are giving away margin through excessive discounting, expensive expedited shipping, or low-margin product mixes.
* **Drilldown:** Click **Open Order P\&L >** in the top-right corner of the card to inspect line-item profitability down to the individual order level.
***
## 3. Performance & Margin Reconciliation
The middle section of the dashboard exposes where revenue leaks occur, which geographies buy the most, and which product categories drive your catalog.
**The 8:00 AM Rule:** Most founders lose 1 to 2 hours every morning cross-referencing mismatched spreadsheets. The Brandstack dashboard is built so you can assess top-line revenue, true bank margin, cash collection risk, and operational fires in under **3 minutes**.
***
## 1. Top KPI Strip: The True Health of Your Brand
At the top of your dashboard sits the 6-metric executive health strip. In e-commerce, **headline revenue is vanity, invoiced sales is reality, and net margin is survival**. Brandstack displays this 3-tier truth side by side:
**Total value of all orders placed**, before any customer discounts, cancellations, or returns.
*Why it matters:* Tells you total market demand and top-of-funnel checkout volume.
**Actual billed revenue** generated from orders that were successfully confirmed and packed.
*Formula:* `Gross Sales − Discounts − Pre-Dispatch Cancellations`
**Cash kept by your business** after accounting for customer returns and RTOs (Return to Origin).
*Formula:* `Invoiced Sales − Customer Returns − RTO Orders`
Shows total orders placed alongside the count of orders **already fulfilled and dispatched** by your warehouse.
*Why it matters:* Instantly flags dispatch backlogs before shipping SLAs breach.
The percentage of revenue that lands in your bank after covering **COGS, shipping, packaging, and payment fees**.
*Why it matters:* If this drops below your target (e.g., 50%), scaling ad spend will burn cash.
Average net transaction size across all channels.
*Why it matters:* Higher AOV gives your marketing team breathing room against rising ad CPMs.
Every KPI card includes a **real-time sparkline** and a **percentage change indicator** comparing the current period (e.g., `Last 30 days`) to the previous period. A red indicator (`↘`) flags areas requiring attention, while green (`↗`) signals positive growth.
***
## 2. Overview: Daily Velocity & Profit Alignment
Directly below the KPI strip, the **Overview** section contrasts top-line channel volume against actual net margin.
### A. Sales by Channel (Invoiced Sales)
This interactive, stacked bar chart maps your daily invoiced revenue across every storefront and marketplace:
* **Shopify (D2C Store)** — Direct web sales
* **Amazon** — Seller Central orders
* **Flipkart** — Seller Hub orders
* **Myntra** — PPMP orders
* **Eternz** — Partner marketplace sales
**What to look for:** Look for spikes and channel concentration. If Shopify spikes on a weekend while marketplaces stay flat, evaluate whether your D2C ad spend cannibalized marketplace organic discovery or if a specific influencer campaign drove direct traffic.
### B. Net Sales vs Net Margin
This dual-axis visualizer plots **Net Sales (tan vertical bars)** against **Net Margin (green line overlay)**:
* **The Insight:** High sales days do not always equal high profit days. If Net Sales shoots up by 2× on a promotion day but the Net Margin curve stays flat or dips, you are giving away margin through excessive discounting, expensive expedited shipping, or low-margin product mixes.
* **Drilldown:** Click **Open Order P\&L >** in the top-right corner of the card to inspect line-item profitability down to the individual order level.
***
## 3. Performance & Margin Reconciliation
The middle section of the dashboard exposes where revenue leaks occur, which geographies buy the most, and which product categories drive your catalog.
 ### A. The Sales Summary Waterfall
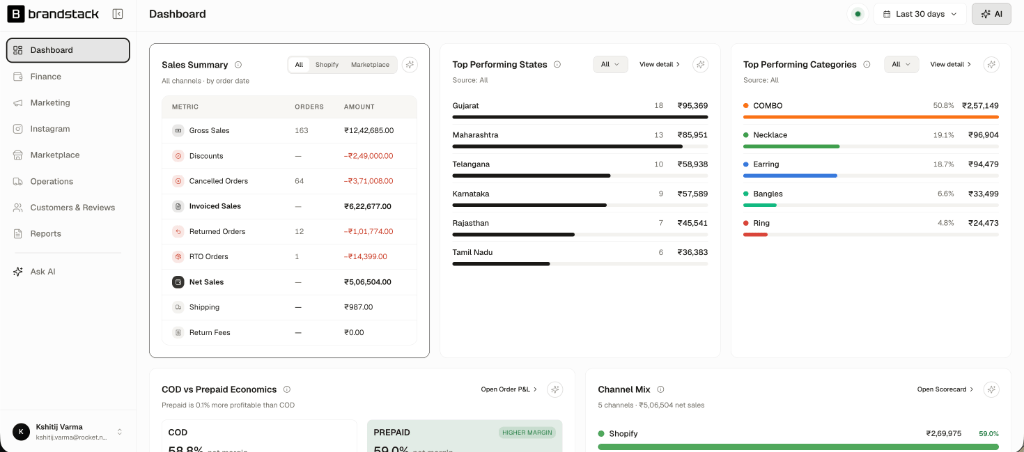
In multi-channel e-commerce, money leaks at multiple stages between customer intent and bank settlement. The **Sales Summary Table** provides a transparent reconciliation:
| Stage | What It Measures | Business Impact |
| :------------------------- | :----------------------------------------------------------------------- | :--------------------------------------------------------------------------- |
| **Gross Sales** | Total order volume placed (e.g., ₹12,42,685 across 163 orders). | Unconstrained demand signal. |
| **Discounts** | Total promotional savings granted (e.g., −₹2,49,000). | Measures discount dependency and margin erosion. |
| **Cancelled Orders** | Orders cancelled before dispatch (e.g., 64 orders / −₹3,71,008). | Flags fake COD orders, payment gateway drop-offs, or slow warehouse packing. |
| **Invoiced Sales** | Real dispatched value (e.g., ₹6,22,677). | Revenue out the warehouse door. |
| **Returned Orders** | Delivered orders returned by customers (e.g., 12 orders / −₹1,01,774). | Sizing, quality, or expectation mismatches. |
| **RTO Orders** | Shipments undelivered and returned to origin (e.g., 1 order / −₹14,399). | Customer unavailability, incorrect address, or buyer remorse. |
| **Net Sales** | Final retained sales (e.g., ₹5,06,504). | Real revenue that pays your bills. |
| **Shipping & Return Fees** | Direct logistics costs deducted. | Friction costs of fulfillment. |
**The Silent Margin Killer:** Notice in the example data that out of ₹12.42L in gross orders, **₹6.2L was lost to discounts and pre-dispatch cancellations alone**, and another **₹1.16L was lost to customer returns and RTOs**. Tracking only gross sales would make this business appear 2.4× larger than its real bankable revenue!
### B. Top Performing States & Categories
* **Top States:** Ranks order volume and revenue by state (e.g., Gujarat with 18 orders / ₹95.3K, Maharashtra with 13 orders / ₹85.9K). Cross-reference this with courier delivery SLAs to see where to place regional warehouse inventory.
* **Top Categories:** Shows percentage contribution by catalog category (e.g., **COMBO** accounting for 50.8% of sales at ₹2.57L, followed by Necklaces at 19.1% and Earrings at 18.7%). When bundles/combos dominate, your AOV remains high and amortizes fixed shipping costs.
***
## 4. Unit Economics: COD vs. Prepaid & Channel Mix
Cash flow and unit economics vary wildly depending on how customers pay and where they purchase. Brandstack isolates these economics into dedicated scorecards:
### A. The Sales Summary Waterfall
In multi-channel e-commerce, money leaks at multiple stages between customer intent and bank settlement. The **Sales Summary Table** provides a transparent reconciliation:
| Stage | What It Measures | Business Impact |
| :------------------------- | :----------------------------------------------------------------------- | :--------------------------------------------------------------------------- |
| **Gross Sales** | Total order volume placed (e.g., ₹12,42,685 across 163 orders). | Unconstrained demand signal. |
| **Discounts** | Total promotional savings granted (e.g., −₹2,49,000). | Measures discount dependency and margin erosion. |
| **Cancelled Orders** | Orders cancelled before dispatch (e.g., 64 orders / −₹3,71,008). | Flags fake COD orders, payment gateway drop-offs, or slow warehouse packing. |
| **Invoiced Sales** | Real dispatched value (e.g., ₹6,22,677). | Revenue out the warehouse door. |
| **Returned Orders** | Delivered orders returned by customers (e.g., 12 orders / −₹1,01,774). | Sizing, quality, or expectation mismatches. |
| **RTO Orders** | Shipments undelivered and returned to origin (e.g., 1 order / −₹14,399). | Customer unavailability, incorrect address, or buyer remorse. |
| **Net Sales** | Final retained sales (e.g., ₹5,06,504). | Real revenue that pays your bills. |
| **Shipping & Return Fees** | Direct logistics costs deducted. | Friction costs of fulfillment. |
**The Silent Margin Killer:** Notice in the example data that out of ₹12.42L in gross orders, **₹6.2L was lost to discounts and pre-dispatch cancellations alone**, and another **₹1.16L was lost to customer returns and RTOs**. Tracking only gross sales would make this business appear 2.4× larger than its real bankable revenue!
### B. Top Performing States & Categories
* **Top States:** Ranks order volume and revenue by state (e.g., Gujarat with 18 orders / ₹95.3K, Maharashtra with 13 orders / ₹85.9K). Cross-reference this with courier delivery SLAs to see where to place regional warehouse inventory.
* **Top Categories:** Shows percentage contribution by catalog category (e.g., **COMBO** accounting for 50.8% of sales at ₹2.57L, followed by Necklaces at 19.1% and Earrings at 18.7%). When bundles/combos dominate, your AOV remains high and amortizes fixed shipping costs.
***
## 4. Unit Economics: COD vs. Prepaid & Channel Mix
Cash flow and unit economics vary wildly depending on how customers pay and where they purchase. Brandstack isolates these economics into dedicated scorecards:
 ### A. COD vs. Prepaid Economics
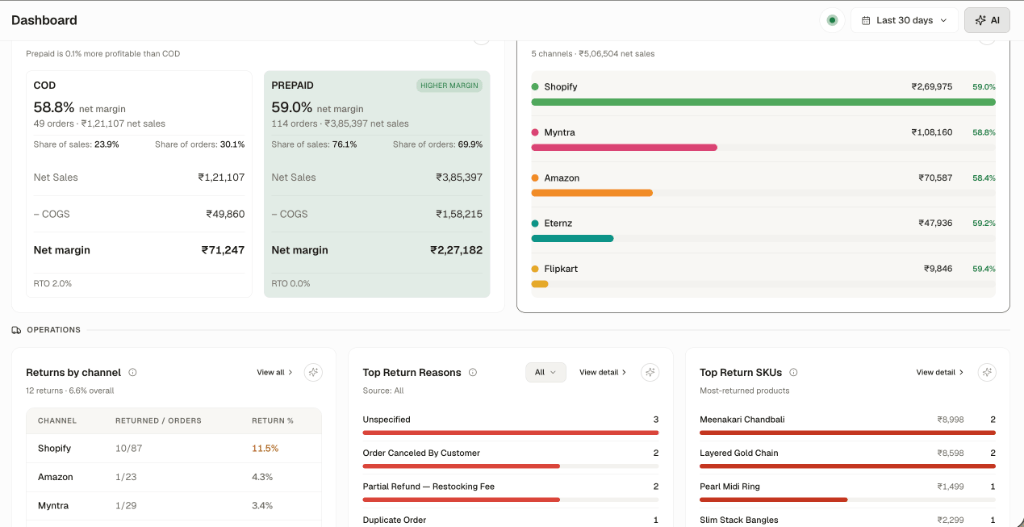
Cash on Delivery (COD) remains the backbone of Indian e-commerce, but it carries higher working capital drag, customer refusal risk, and RTO expenses:
| Metric | COD Orders | Prepaid Orders | Strategic Takeaway |
| :------------------ | :---------------- | :-------------------------- | :------------------------------------------------- |
| **Net Margin %** | **58.8%** | **59.0%** (`HIGHER MARGIN`) | Prepaid yields higher clean margins. |
| **Share of Orders** | 30.1% (49 orders) | 69.9% (114 orders) | A healthy prepaid-dominant mix protects cash flow. |
| **Net Sales** | ₹1,21,107 | ₹3,85,397 | 76.1% of revenue is prepaid. |
| **COGS** | ₹49,860 | ₹1,58,215 | Direct inventory replacement cost. |
| **Net Margin** | ₹71,247 | ₹2,27,182 | Bankable gross profit. |
| **RTO Rate** | **2.0%** | **0.0%** | **Prepaid orders have zero RTO loss.** |
**Founder Action:** When COD RTO climbs above 10%, implement automated WhatsApp confirmation, address validation, or offer a 5% discount to switch buyers to UPI/Prepaid at checkout.
### B. Channel Mix Scorecard
Ranks each sales channel by its **Net Sales** contribution and **Net Margin %**:
1. **Shopify (D2C):** ₹2,69,975 net sales · **59.0% margin** (Highest volume and healthy direct margin).
2. **Myntra:** ₹1,08,160 net sales · **58.8% margin** (High fashion volume with predictable commissions).
3. **Amazon:** ₹70,587 net sales · **58.4% margin**.
4. **Eternz:** ₹47,936 net sales · **59.2% margin**.
5. **Flipkart:** ₹9,846 net sales · **59.4% margin**.
Comparing net margins across channels tells you where to allocate inventory when stock is constrained.
***
## 5. Operations, Returns & The State Action Matrix
The bottom section of the dashboard safeguards your business against reverse-logistics bleed.
### A. COD vs. Prepaid Economics
Cash on Delivery (COD) remains the backbone of Indian e-commerce, but it carries higher working capital drag, customer refusal risk, and RTO expenses:
| Metric | COD Orders | Prepaid Orders | Strategic Takeaway |
| :------------------ | :---------------- | :-------------------------- | :------------------------------------------------- |
| **Net Margin %** | **58.8%** | **59.0%** (`HIGHER MARGIN`) | Prepaid yields higher clean margins. |
| **Share of Orders** | 30.1% (49 orders) | 69.9% (114 orders) | A healthy prepaid-dominant mix protects cash flow. |
| **Net Sales** | ₹1,21,107 | ₹3,85,397 | 76.1% of revenue is prepaid. |
| **COGS** | ₹49,860 | ₹1,58,215 | Direct inventory replacement cost. |
| **Net Margin** | ₹71,247 | ₹2,27,182 | Bankable gross profit. |
| **RTO Rate** | **2.0%** | **0.0%** | **Prepaid orders have zero RTO loss.** |
**Founder Action:** When COD RTO climbs above 10%, implement automated WhatsApp confirmation, address validation, or offer a 5% discount to switch buyers to UPI/Prepaid at checkout.
### B. Channel Mix Scorecard
Ranks each sales channel by its **Net Sales** contribution and **Net Margin %**:
1. **Shopify (D2C):** ₹2,69,975 net sales · **59.0% margin** (Highest volume and healthy direct margin).
2. **Myntra:** ₹1,08,160 net sales · **58.8% margin** (High fashion volume with predictable commissions).
3. **Amazon:** ₹70,587 net sales · **58.4% margin**.
4. **Eternz:** ₹47,936 net sales · **59.2% margin**.
5. **Flipkart:** ₹9,846 net sales · **59.4% margin**.
Comparing net margins across channels tells you where to allocate inventory when stock is constrained.
***
## 5. Operations, Returns & The State Action Matrix
The bottom section of the dashboard safeguards your business against reverse-logistics bleed.
 ### A. Returns by Channel
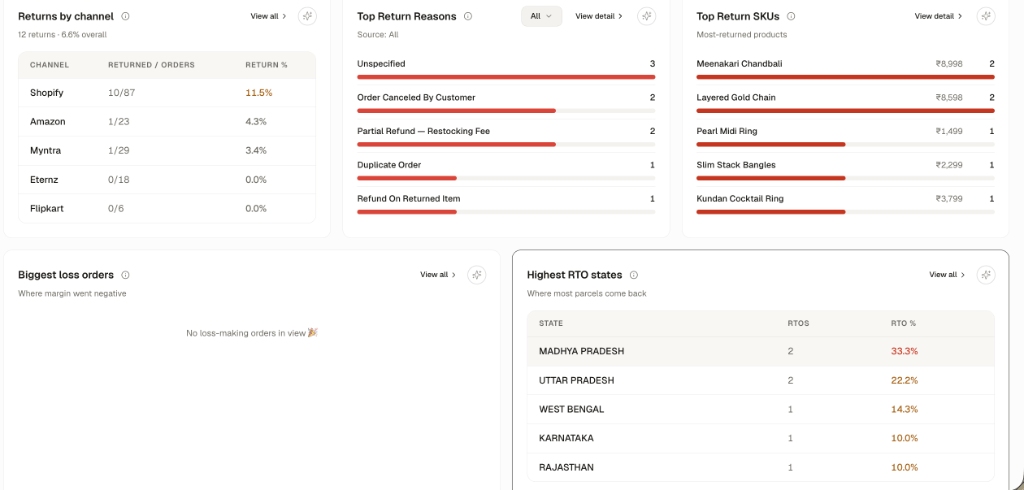
Not all channels experience the same customer behavior. In this breakdown:
* **Shopify:** 10 returns out of 87 orders (**11.5% return rate** — highlighted in amber). D2C customers often order multiple sizes or change their minds.
* **Amazon:** 1 return out of 23 orders (**4.3% return rate**).
* **Myntra:** 1 return out of 29 orders (**3.4% return rate**).
* **Eternz & Flipkart:** **0.0% return rate**.
### B. Root-Cause Analysis: Return Reasons & Top Return SKUs
* **Top Return Reasons:** Pinpoints why customers are sending products back (*Unspecified, Customer Cancellation, Restocking Fee, Duplicate Order*).
* **Top Return SKUs:** Identifies your highest-return individual products:
* *Meenakari Chandbali:* 2 returns totaling ₹8,998
* *Layered Gold Chain:* 2 returns totaling ₹8,598
* *Pearl Midi Ring, Slim Stack Bangles, Kundan Cocktail Ring*
**Watch Out for Trojan Horse SKUs:** A product may be your top seller by gross volume, but if it has a 25% return rate, reverse logistics charges and damaged packaging will silently destroy its profitability. Check this table weekly to identify products needing sizing guides, better imagery, or sturdier packaging.
### C. Highest RTO States (State Action Matrix in Action)
Return to Origin (RTO) occurs when a courier cannot deliver a parcel (customer refused, incorrect phone number, fake address). You pay forward shipping, reverse shipping, and tie up stock:
| State | RTO Count | RTO % | Recommended Action |
| :----------------- | :-------- | :-------- | :---------------------------------------------------------------------- |
| **Madhya Pradesh** | 2 | **33.3%** | 🚨 **High Risk:** Restrict COD or mandate OTP verification. |
| **Uttar Pradesh** | 2 | **22.2%** | 🚨 **High Risk:** Require prepaid or pre-call customer before dispatch. |
| **West Bengal** | 1 | **14.3%** | ⚠️ Monitor: Route only via top-performing courier partners. |
| **Karnataka** | 1 | **10.0%** | Standard processing. |
| **Rajasthan** | 1 | **10.0%** | Standard processing. |
***
## 6. Interactive Features: Inline AI & Instant Drilldown
Every card on the dashboard is interactive:
```
[ Card Header ] ---------------------------- [ Filter ⌄ ] [ View detail > ] [ ✨ AI ]
```
1. **The Inline AI Sparkle (`✨`):** Click the sparkle icon on any card to ask natural-language questions directly about that card's data without switching to a different tab.
* *Examples:*
* *"Why did cancellations spike on September 14?"*
* *"Which pin codes in Madhya Pradesh caused the 33% RTO?"*
* *"Which ad campaign drove the COMBO category sales?"*
2. **One-Click Drilldowns:** Click **View detail >**, **Open Order P\&L >**, or **Open Scorecard >** to jump straight into the full ledger backing any number.
3. **Date & Channel Scoping:** Use the global date picker in the top-right header to switch between `Today`, `Last 7 days`, `Last 30 days`, or custom accounting quarters.
***
## 7. The Founder's 3-Minute Morning Routine
Follow this quick morning checklist to stay completely on top of your brand:
Look at the gap between Invoiced Sales and Net Sales. If the gap is widening, returns or RTOs are compounding.
Check if pre-dispatch cancellations spiked yesterday. If so, inspect whether payment gateway OTPs failed or warehouse dispatch was delayed.
Ensure COD RTO remains under your tolerance threshold (e.g. under 8%). If COD RTO is spiking, check which states are responsible.
If any state exceeds 20% RTO or a specific SKU accounts for multiple returns, notify your fulfillment team to hold dispatches or require customer phone confirmation.
### A. Returns by Channel
Not all channels experience the same customer behavior. In this breakdown:
* **Shopify:** 10 returns out of 87 orders (**11.5% return rate** — highlighted in amber). D2C customers often order multiple sizes or change their minds.
* **Amazon:** 1 return out of 23 orders (**4.3% return rate**).
* **Myntra:** 1 return out of 29 orders (**3.4% return rate**).
* **Eternz & Flipkart:** **0.0% return rate**.
### B. Root-Cause Analysis: Return Reasons & Top Return SKUs
* **Top Return Reasons:** Pinpoints why customers are sending products back (*Unspecified, Customer Cancellation, Restocking Fee, Duplicate Order*).
* **Top Return SKUs:** Identifies your highest-return individual products:
* *Meenakari Chandbali:* 2 returns totaling ₹8,998
* *Layered Gold Chain:* 2 returns totaling ₹8,598
* *Pearl Midi Ring, Slim Stack Bangles, Kundan Cocktail Ring*
**Watch Out for Trojan Horse SKUs:** A product may be your top seller by gross volume, but if it has a 25% return rate, reverse logistics charges and damaged packaging will silently destroy its profitability. Check this table weekly to identify products needing sizing guides, better imagery, or sturdier packaging.
### C. Highest RTO States (State Action Matrix in Action)
Return to Origin (RTO) occurs when a courier cannot deliver a parcel (customer refused, incorrect phone number, fake address). You pay forward shipping, reverse shipping, and tie up stock:
| State | RTO Count | RTO % | Recommended Action |
| :----------------- | :-------- | :-------- | :---------------------------------------------------------------------- |
| **Madhya Pradesh** | 2 | **33.3%** | 🚨 **High Risk:** Restrict COD or mandate OTP verification. |
| **Uttar Pradesh** | 2 | **22.2%** | 🚨 **High Risk:** Require prepaid or pre-call customer before dispatch. |
| **West Bengal** | 1 | **14.3%** | ⚠️ Monitor: Route only via top-performing courier partners. |
| **Karnataka** | 1 | **10.0%** | Standard processing. |
| **Rajasthan** | 1 | **10.0%** | Standard processing. |
***
## 6. Interactive Features: Inline AI & Instant Drilldown
Every card on the dashboard is interactive:
```
[ Card Header ] ---------------------------- [ Filter ⌄ ] [ View detail > ] [ ✨ AI ]
```
1. **The Inline AI Sparkle (`✨`):** Click the sparkle icon on any card to ask natural-language questions directly about that card's data without switching to a different tab.
* *Examples:*
* *"Why did cancellations spike on September 14?"*
* *"Which pin codes in Madhya Pradesh caused the 33% RTO?"*
* *"Which ad campaign drove the COMBO category sales?"*
2. **One-Click Drilldowns:** Click **View detail >**, **Open Order P\&L >**, or **Open Scorecard >** to jump straight into the full ledger backing any number.
3. **Date & Channel Scoping:** Use the global date picker in the top-right header to switch between `Today`, `Last 7 days`, `Last 30 days`, or custom accounting quarters.
***
## 7. The Founder's 3-Minute Morning Routine
Follow this quick morning checklist to stay completely on top of your brand:
Look at the gap between Invoiced Sales and Net Sales. If the gap is widening, returns or RTOs are compounding.
Check if pre-dispatch cancellations spiked yesterday. If so, inspect whether payment gateway OTPs failed or warehouse dispatch was delayed.
Ensure COD RTO remains under your tolerance threshold (e.g. under 8%). If COD RTO is spiking, check which states are responsible.
If any state exceeds 20% RTO or a specific SKU accounts for multiple returns, notify your fulfillment team to hold dispatches or require customer phone confirmation.